Network Insight Tools
Remotely troubleshoot your devices faster by gaining real-time insights into data traffic and a better understanding of device performance.
Resolve your IoT device’s connectivity issues faster
Speed up your development
Deploy with confidence
Boost your device efficiency
IoT businesses building on Onomondo infrastructure
Forget support tickets and access insights immediately
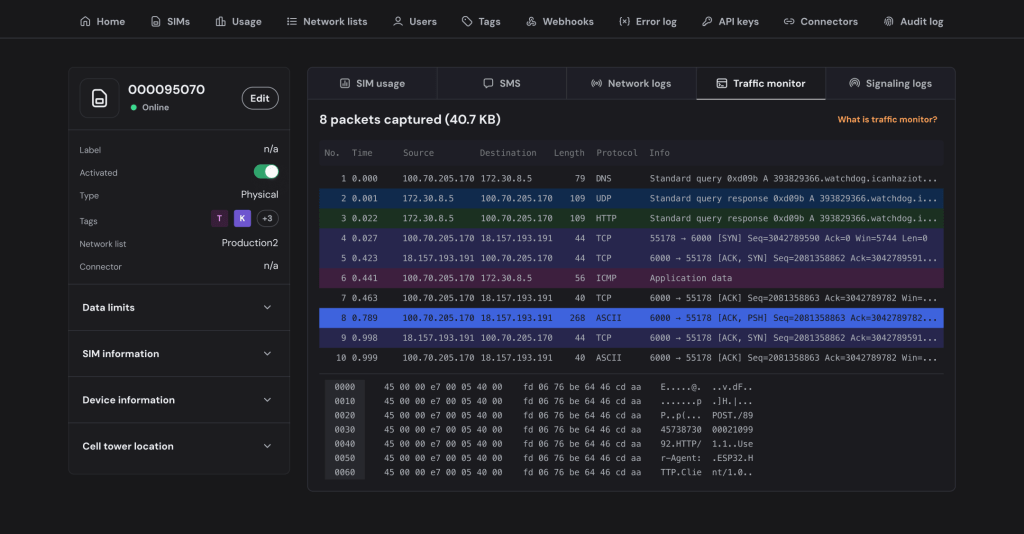
Capture data packets
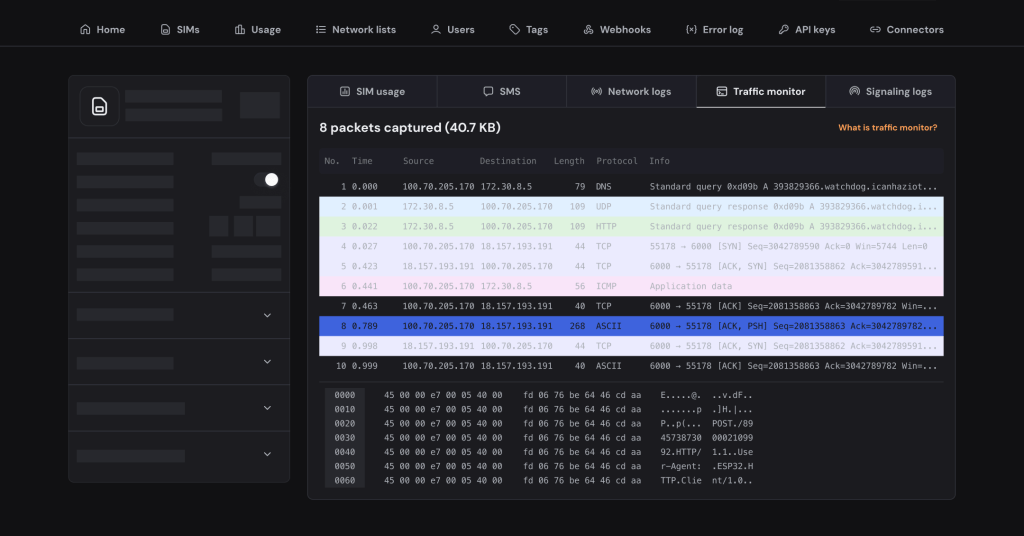
Traffic monitor captures every packet to and from a device in real time, anywhere in the world. Itβs effectively Wireshark inside the core network, globally. Traffic can be exported as PCAP for offline analysis.
See where your devices attach
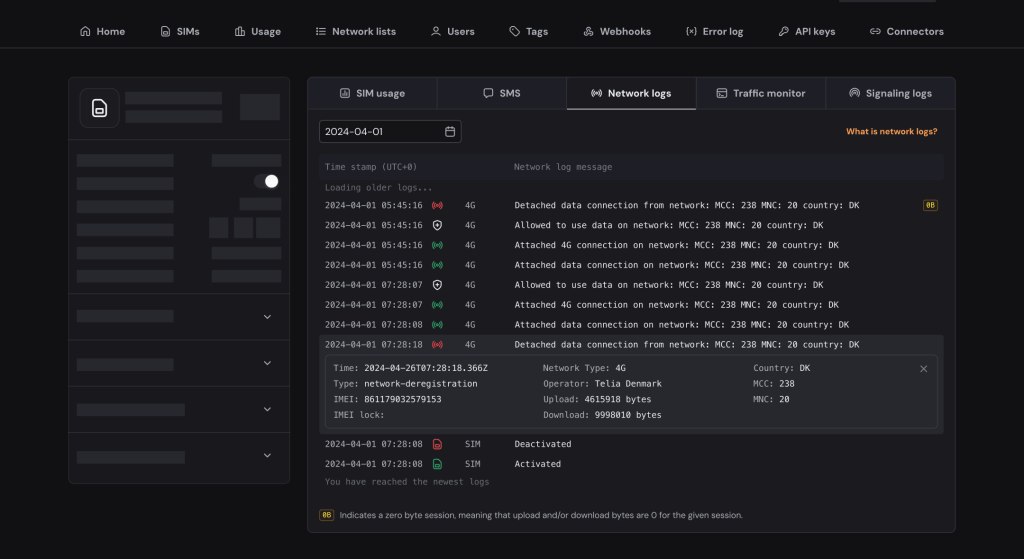
Network Logs show every attach attempt, which network and technology a device used (2G/3G/4G/ LTE-M/ NB-IoT), and the reason for any authentication failure, such as a network_whitelist error when a SIM tries a network not in its Network List.
Diagnose network behavior
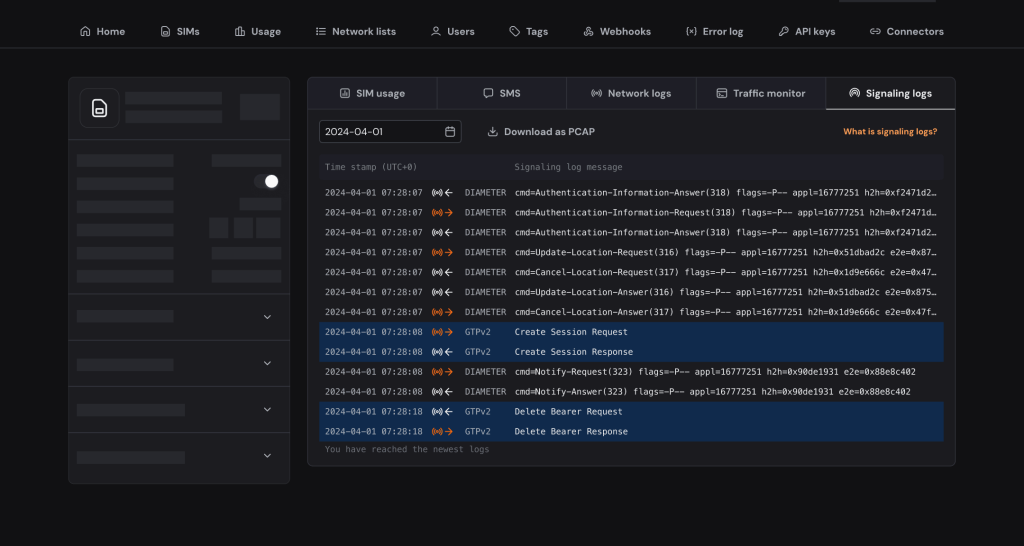
Signaling Logs expose the packets exchanged between the local RAN and Onomondo, giving protocol-level insight (e.g. GSM MAP, GTP) for diagnosing exactly why a connection behaves the way it does.
Get in touch
We couldn’t load this form right now. Please reload the page to try again.
Related articles
Read articles and reports to learn more about Insight Tools.
IoT connectivity Signaling Logs explained
Simplify troubleshooting with Network Logs