

Have you ever tried to get signaling information from your operator?
It’s a pain, especially for global deployments, when third parties are involved.
Our approach is to show companies using our global IoT SIMs everything, including signaling information in real-time via our API and IoT Connectivity Platform.
This article explains Signaling Logs and how to make use of them when debugging cellular IoT devices.
Table of Contents
What are Signaling Logs?
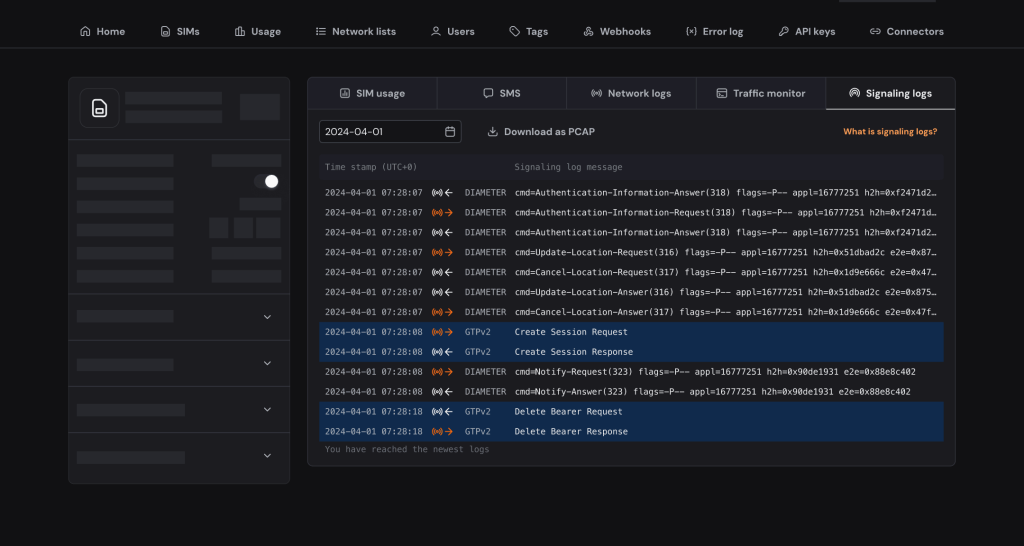
Signaling Logs give you an instant overview of the packets sent between local RANs (Radio Access Networks) and Onomondo.
When a device connects to a network there is a lot of signalling information between the RAN and Onomondo. Normally you are not able to see this unless you request it from an operator.
With Onomondo you are able to get the signalling information in realtime directly in the app, no matter where in the world the device is. The logs are also stored so you can always go back and dive into it later.
We can do that because we integrated our Core Network with over 700 RANs globally.
You can think of it as going a level deeper than Network Logs.
So when you log in to Onomondo or use our API and webhooks to see Signaling Logs, you get an instant overview of the packets sent between the RAN and Onomondo.
Now you can:
- Debug devices faster.
- Reduce downtime and service issues.
- Download historical PCAP files on specific devices.
- Not have to rely on third parties for insights.
Signaling information example
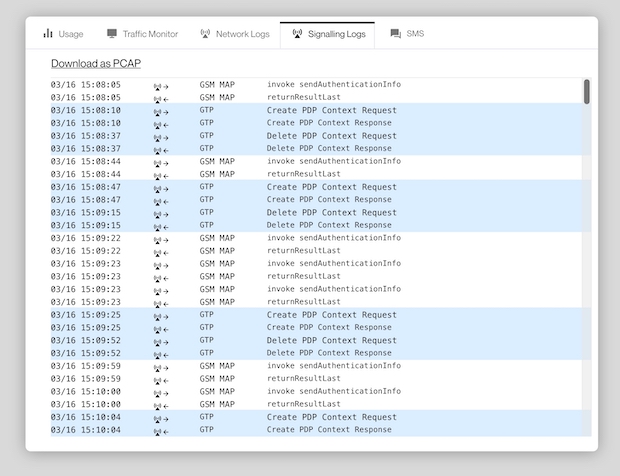
Signaling Logs help you dive into signaling protocol information, you have Diameter, GSM MAP, GTP, and GTP version two.
You can also download the signaling information on a SIM as a PCAP file and then you can open Wireshark and really go into the details of why something might not be working the way you want it to.

An example of how Signaling Logs can be useful with debugging is when you see a SIM is activated in the Network Logs but you’re still not receiving data.
In this scenario, it would make sense to dig a bit deeper using Signaling Logs.
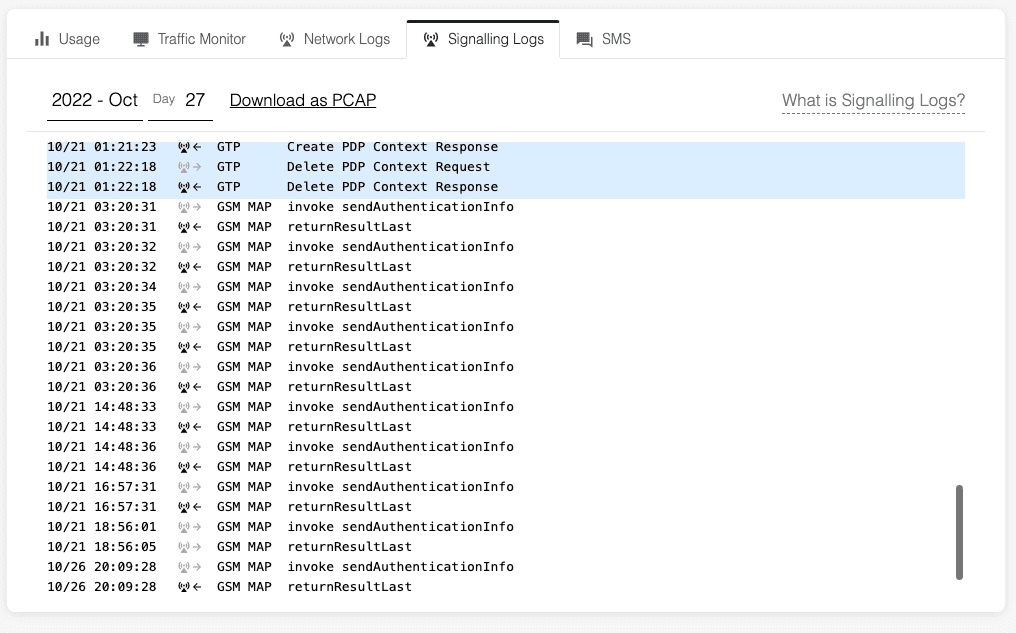
You could see an authentication request and response loop, something that occurs when your device is looking for networks at the start of the connection process, but gets stuck.
When using AT Commands on the device, this would be a response of +CREG/+CGREG/+CEREG: 2.
Learn more:
Signaling authentication loops like this indicate that the device needs to be reset to get out of a bad state, or the local network is rejecting the device (e.g. for load balancing) and the problem might solve itself with time.
And that’s a brief example of how Signaling Logs can help you debug cellular IoT devices remotely. I hope this helps you understand the value of Signaling Logs and speeds up your debugging processes.