

Regardless of the IoT solution you have, issues will still occur, no matter how well you prepare.
After an IoT product is released, it’s put through thousands of new situations that weren’t thought of during development, and errors are inevitable.
The stakes are high. If your technology goes down, your clients might think it’s not reliable and stop working with you.
That’s why you need to get timely information for IoT device troubleshooting problems.
This report looks at two common problems with cellular IoT devices and how Onomondo’s insight tools can be used to analyze them.
After reading this, you should have a better understanding of how to remotely fix problems with IoT devices and how Onomondo can help reduce downtime thanks to global network diagnostics.
Here’s what we’ll cover:
The trouble with IoT device troubleshooting
Troubleshooting devices that are in remote locations is typically complicated, expensive, and involves long wait times.
Your options for troubleshooting are limited:
- Trial and error: If your devices can connect to a network, you can try pushing out updates and hope they work.
- Visit devices: You can send a technician out to the affected devices to debug the problem.
- Help tickets: You can contact third-party carriers to get traces, then wait for tickets to be responded to.
- Self-service: You have access to the info you need to figure out the problem and deploy fixes.
The best scenario is to be able to troubleshoot and fix problems right away on your laptop.
But it’s normally not so easy to get useful information about connectivity in a timely manner. This is thanks to how IoT connectivity is traditionally set up, where connectivity is treated like a black box with limited self-service data.
Network debugging tools
The amount of information you can get about what is happening between your device, the network, and the cloud will vary widely depending on your own tech stack.
Whether you use your own server or a third-party server, how and what metrics and/or logs you collect from your device, and who you choose as your connectivity partner will affect how well you can debug.
Here’s information that some connectivity providers can offer you that will help you debug problems:
- Network Logs: ideally your connectivity provider has an overview of the networks the SIM has connected to.
- Network Signaling: ideally you can contact the network providers and get the “traces” from them.
- Traffic Capturing: ideally you could run “wireshark” on your server to see if the device is sending data to your server.
With Onomondo, you only need one operator for global connectivity, and you can get insights in real-time with purpose-built tools: Network Logs, Signaling Logs, and Traffic Monitor.
Because of these tools, IoT device troubleshooting is quick, so problems can be found and fixed with minimal fuss.
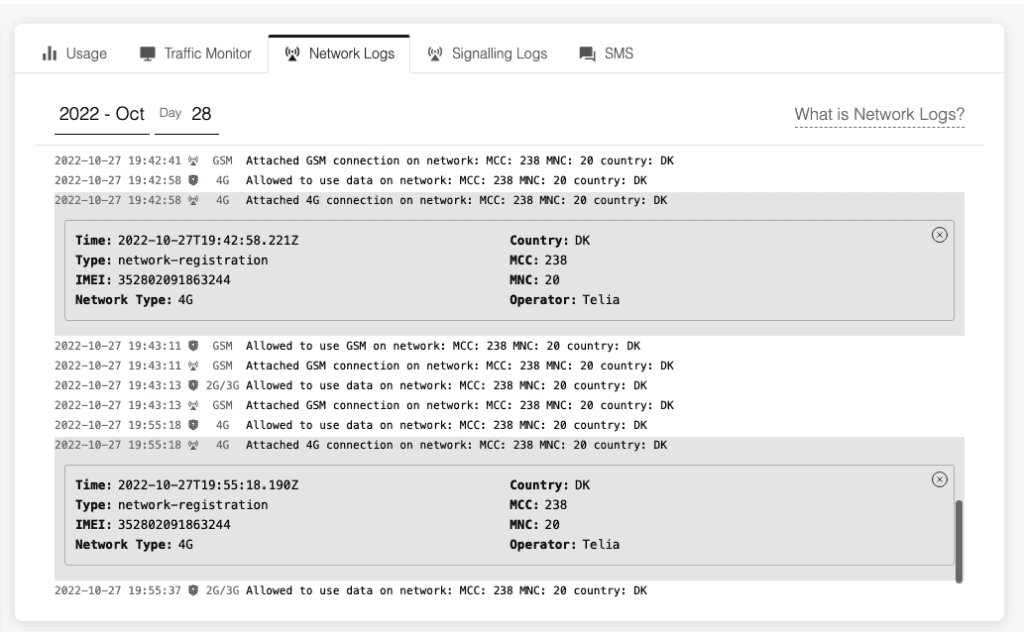
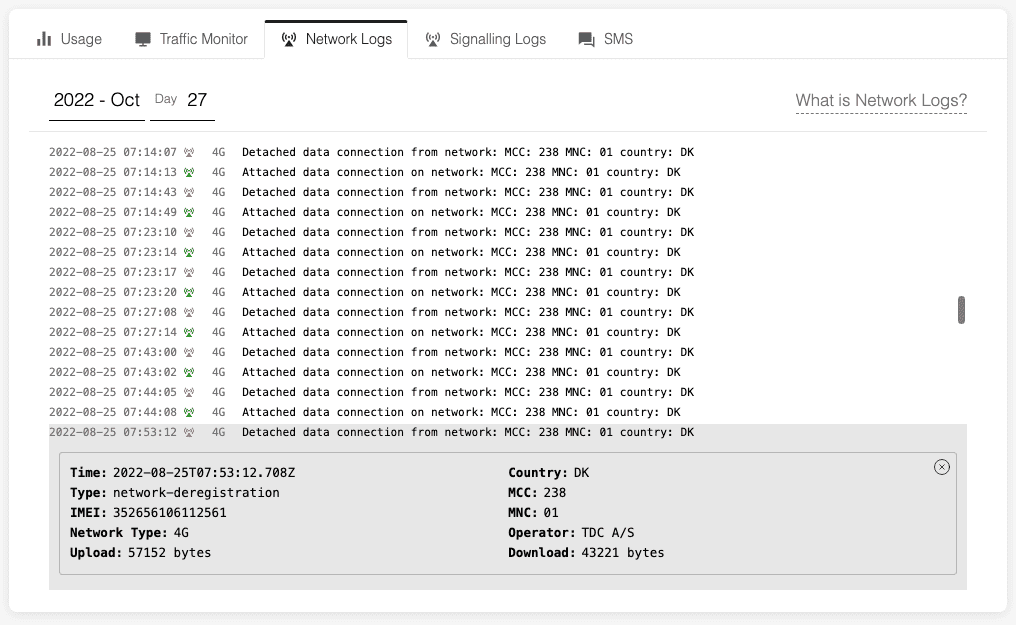
Network Logs show you historical network authentication data. You can view this to see what networks your devices connect to and see network preference changes. You can also see information about changes to Network Lists and when usage limits are hit. Learn more: Simplify troubleshooting with Network Logs.
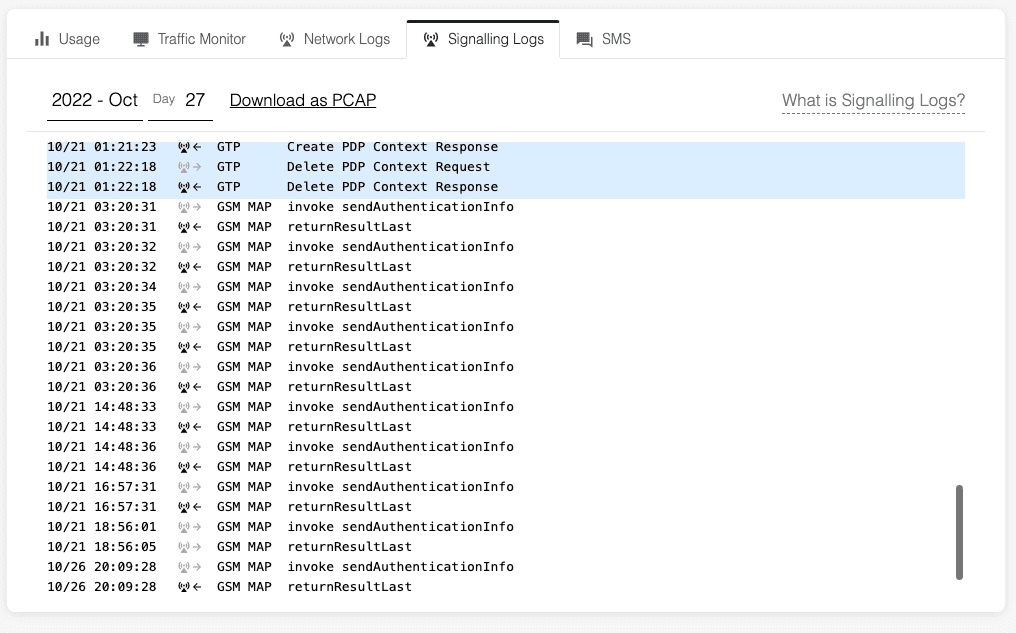
Signaling Logs go further than network logs, capturing the various signaling protocols going between the RAN and Onomondo. You can dive into these deeper to see things like the Diameter, GSM MAP, GTP, and GTPv2. Learn more: IoT connectivity Signaling Logs explained.
Traffic Monitor is a live feed of traffic packets going to and from the device and network. This allows you to analyze traffic without installing anything on the device. Learn more: Traffic Monitor for IoT devices explained.
Now let’s look at two common problems with deployed devices and how you can resolve them with Onomondo’s insight tools.
Problem 1: You expect to receive data from a device, but don’t.
Most IoT use cases have scheduled times where devices send data to a server. When data does not arrive, you need to investigate what could be causing the issue.
In general, the things that you need to check are:
- Can the device connect to a network?
- Can the device establish a data connection?
- Can the device send data?
Using Onomondo’s insight tools, you can see in real-time what is happening and narrow down where to look for a possible issue and root cause.
Can the device connect to a network?
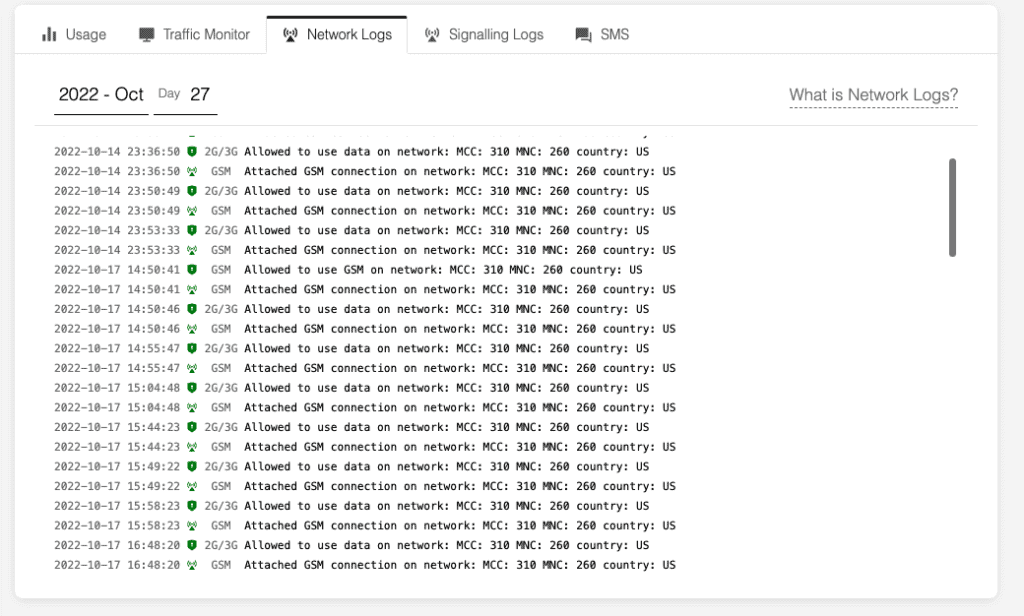
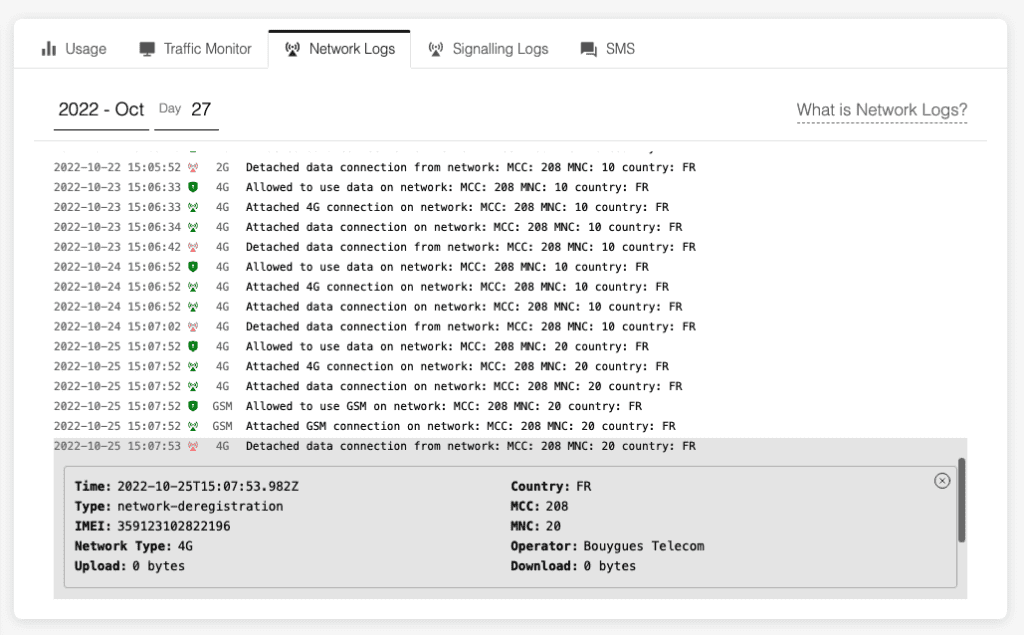
Network Logs will show you if your device can connect to a network.
You will see network attach and detach information. For example, in LTE, the network registration shown as “attached 4G connection” is the same as seeing +CEREG: 5 on the device.
You can also see SIM events, such as SIM deactivation, network list changes, and data limits.
If the SIM is deactivated, the device won’t be able to connect to the network and no data will be received.
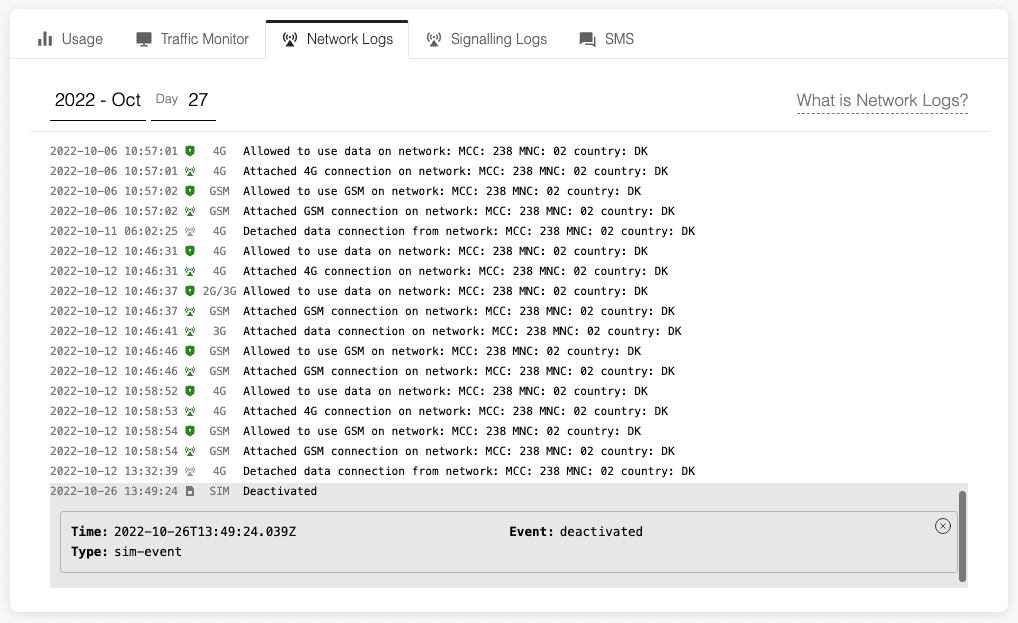
If the SIM is deactivated, try activating the SIM to solve the issue.
If your SIM is activated and you’re still not receiving data, it would make sense to look at the Signaling Logs.
You may see a loop of authentication requests and responses. This happens when the device is stuck looking for networks at the start of the connection process. On the device, this would be a response of +CREG/+CGREG/+CEREG: 2.
Signaling authentication loops often indicate that:
- The device is stuck in a bad state and should be reset, or
- the local network is rejecting the device (e.g. for load balancing) and the problem might solve itself with time.
If the signaling logs are empty, it means the device hasn’t tried to attach to the network.
The absence of signaling logs can mean:
- There are no networks available with your technology in the area. For example, a 3G device in a country where no 3G is available.
- All networks in the area have been written to the Forbidden Network (FPLMN) list on the SIM and the list needs to be cleared.
- The device firmware is not currently set up to work with non-steered or roaming SIMs and needs to be updated.
Can the device establish a data connection?
At this stage, we can see that the device has connected to a network but no data has been received at the server end. So now you’ll want to check whether a data connection was established.
Onomondo’s Network Logs show a log with the description “Attached data connection” when the device has activated an APN context and is able to send data.
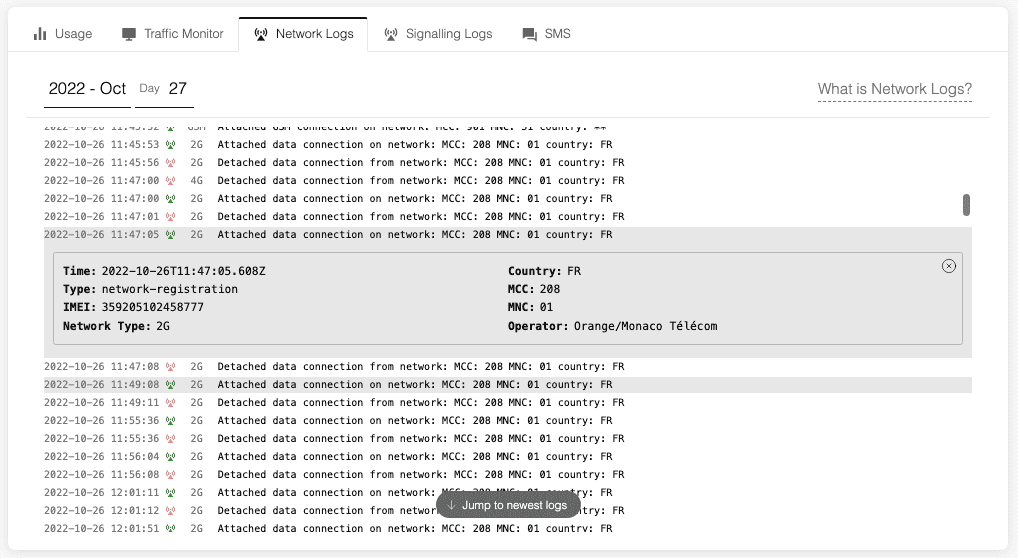
If you see a repetition of network connection without the “data attachment connection” network logs, then the device is looping through connection attempts without creating the data connection.
First, thing to check is that the device has not reached its data limit. Look back to when the device was last online (attached data connection). Is there a SIM Event “Data Limit Reached”?
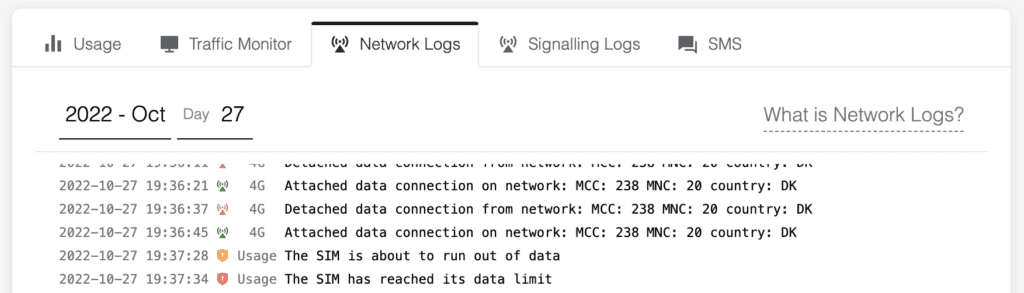
Now you know the data limit has been reached and no data can be sent. On the SIM page of the platform, you can check when the data limit will be reset and how much data the device has used.
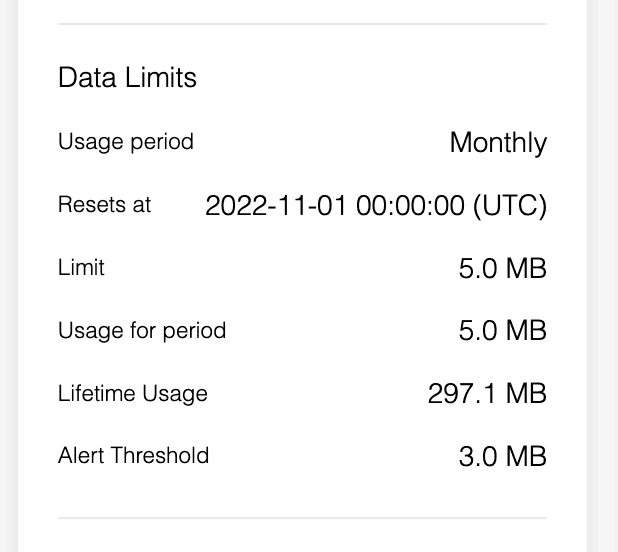
You can update the data limit or wait until the next period for the device to start sending data again.
If the device hasn’t reached a data limit, you can assume the problem lies elsewhere.
These are the most common issues in that case:
- The APN isn’t set correctly. It should be “onomondo” (all lowercase).
- The device has an “allow data roaming” setting that is not enabled.
- The device is using CREG: 5 (or CREG: 1) to trigger the APN context activation. Instead, use CEREG: 5 for LTE and CGREG: 5 for older connections.
Can the device send data?
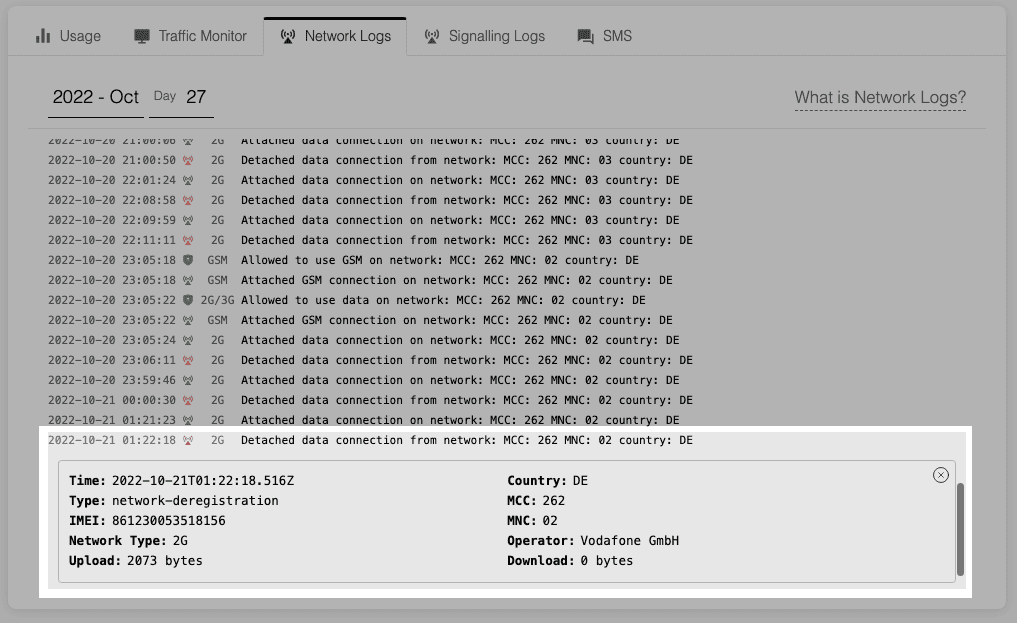
If you are seeing “data attach” followed by a “data detach” network logs, check the details of the detach record to see if any data was transmitted in that session.
If no data was sent, you can use Signaling Logs to check if the Onomondo Core Network is receiving PurgeUE requests coming from the local network.
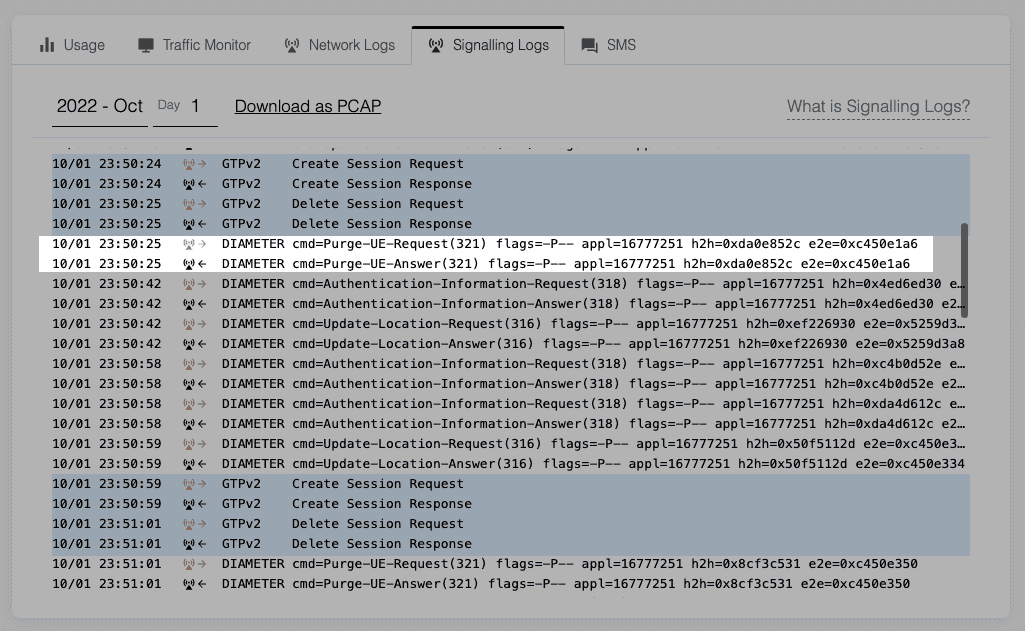
Purge requests are a common part of signaling and either come from the device itself or the local network.
They are a notification from the local network that the SIM’s authentication credentials are being erased from memory. If there is some time between the last signaling and the PurgeUE request then the local RAN has removed the device due to inactivity.
However, if you see this signaling directly after detach (Delete PDP/Session Request) from the RAN, then often it is the device that is receiving an error during this stage and starting the connection process again.
Unexpected Purge requests are commonly caused by:
- The device connection firmware needs to be optimized (short timeouts, triggering attach on CREG).
- The device is not handling DNS on a specific network. This is a device side error which happens before any data is sent (meaning there is nothing in the packet trace).
- The network is closing the connection.
If there is data usage in the sessions, you will need to use Traffic Monitor to capture a packet trace next time it comes online to know why you are not receiving it. We’ll dig into Traffic Monitor in the next problem outline.
Problem 2: Unexpected data usage.
Devices in an IoT deployment often have a consistent data traffic footprint. When a device behaves unusually, it’s important to figure out why it’s not working as expected.
Here are some common scenarios that could be causing the unexpected data usage:
- Time sync failing.
- The device is sending data but there is no response from the server (the server firewall is not allowing traffic from your operator’s IP addresses or the device is sending to the incorrect server).
- The TLS is failing its handshake.
- TCP has too many retransmissions / TCP sockets keep being reset.
- Unauthorized use of SIM / Unauthorized access to the device.
If you notice a device is sending more traffic than expected, you can run a packet trace using Traffic Monitor.
With Traffic Monitor, you’ll see information on all traffic passing through our core network without setting anything up on your device.
Note: Setting up a Usage Alert webhook and adding data thresholds on SIMs is good practice. It means you will be notified if a device is using more traffic than expected.
Is the upload traffic too high?
In Network Logs, you can see how much data usage you have during a session by looking at the details of a detach network log.
If you see very little download traffic, the problem is often the server not responding to the device.
If the server is not responding to the device, it would make sense to check the following:
- The server has a firewall and does not have Onomondo’s public IP addresses.
- The device is trying to send data to the wrong server.
- DNS requests are not resolving.
- The device is pinging a host but not getting a response.
If you use Traffic Monitor on your next connection, it will record the packets and show what is going on.
Note: You can also use our Traffic Monitor CLI tool when it doesn’t make sense to have a browser up and running for extended periods of time.
Is the upload and download traffic too high?
If you’re seeing a higher amount of traffic in both upload and download, there might be an issue with the encryption on the transport layer.
Solution: In these cases, it is common to see the following:
- The TLS is failing its handshake.
- MTU on device is too high (Onomondo’s MTU is 1360).
- TCP has too many retransmissions / the TCP socket keeps being reset.
- The server or device is closing the TCP socket prematurely.
- Unauthorized use of SIM / Unauthorized access to device.
Once again, you will get a good idea of what the issue is by using Traffic Monitor the next time the device connects.
The Onomondo platform can be used for a quick overview, but often it helps to open the PCAP file in Wireshark for further analysis.
And that’s it! I hope this IoT device troubleshooting guide helps you debug devices quicker and increases your fleet uptime.